
What Is a Trading Chart?
Understanding what a trading chart is will change the way you look at the market forever. You’ve completed all of Trading Basics — from what trading is to order types. Now begins one of the most exciting parts of your journey: learning to actually read a trading chart. This single skill separates traders who guess from traders who understand what’s actually happening in the market.
Table of Contents
- What Is a Trading Chart?
- Why Charts Matter More Than News
- The Two Axes of Every Chart
- Common Chart Types
- What a Chart Actually Represents
- How to Start Reading a Chart
- Why This Category Is the Foundation of Everything Ahead
- Frequently Asked Questions
1. What Is a Trading Chart?

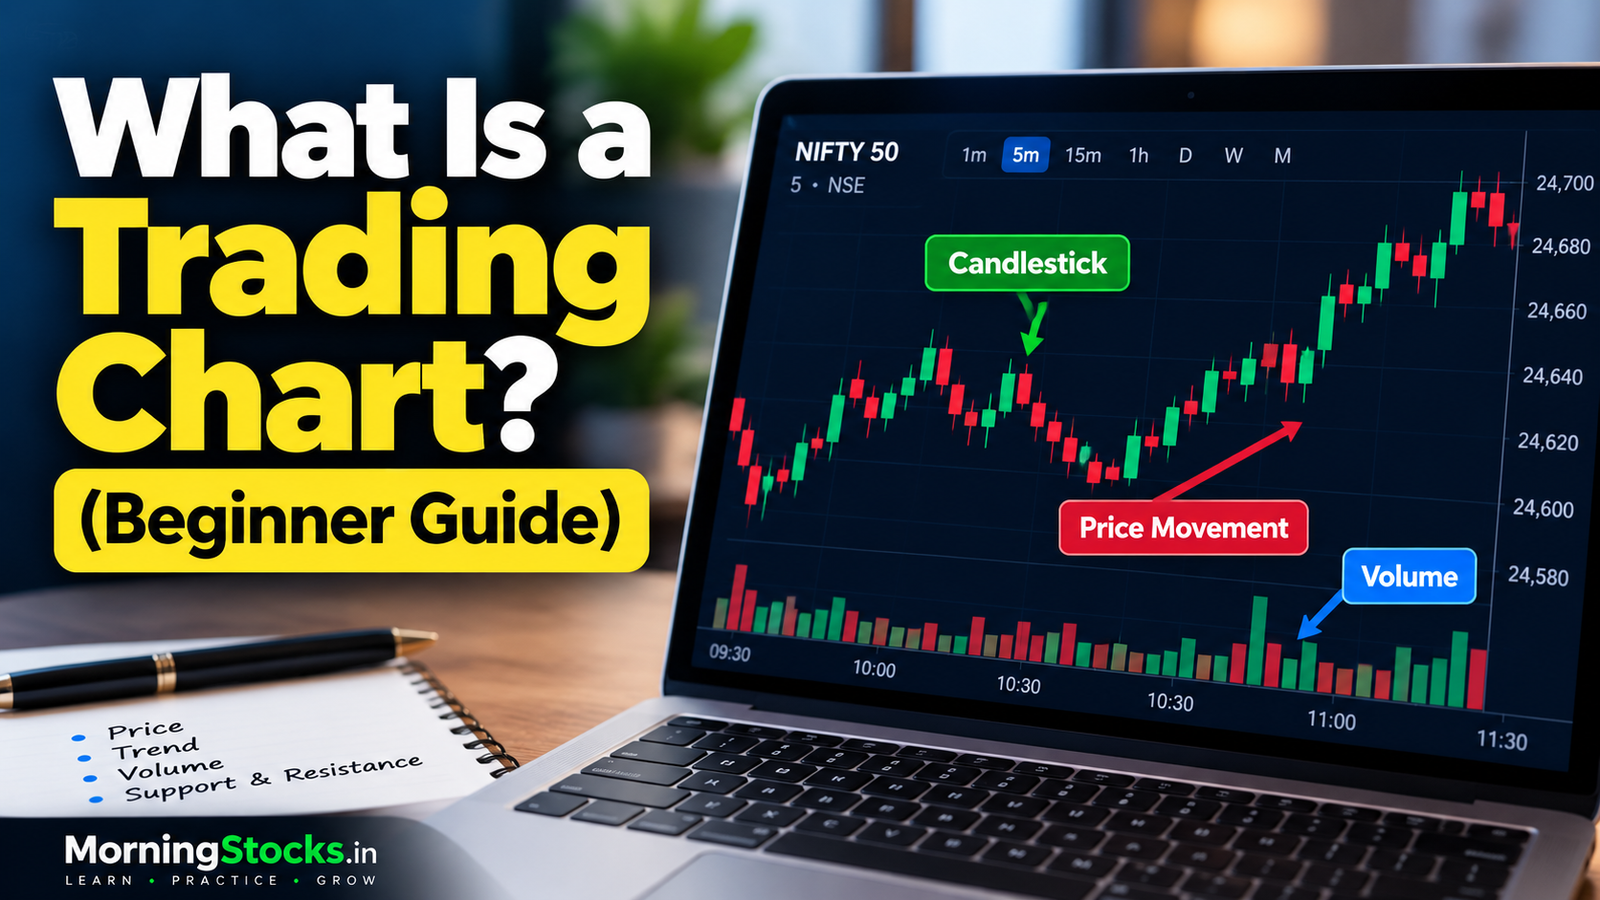
A trading chart is a visual representation of a stock’s (or any instrument’s) price movement over time. Instead of reading a long list of numbers, a chart lets you see how price has moved — rising, falling, or moving sideways — across minutes, hours, days, or years, depending on what you choose to view.
Every single trading decision covered later in this series — price action, support and resistance, market structure — is built entirely on top of your ability to read a chart correctly. This is why we treat it as its own full category, right after the basics.
2. Why Charts Matter More Than News

New traders often assume that reading financial news is the key to good decisions. In reality, by the time news is public, the price has usually already reacted — professional and institutional traders often move first, and that movement shows up on the chart before most retail traders even hear the news.
This doesn’t mean news is irrelevant. It means the chart shows you what the market is actually doing right now, while news only tells you what has already happened or what people expect. Learning to read price action directly from the chart is a skill news alone cannot replace.
3. The Two Axes of Every Chart

Every trading chart has two simple axes:
- Vertical axis (Y-axis): Represents price — how high or low the value has moved.
- Horizontal axis (X-axis): Represents time — how the price has changed across minutes, hours, days, or years.
Everything on a chart is simply price plotted against time. Once this clicks, charts stop looking intimidating and start looking like a simple, readable story.
4. Common Chart Types

There are several ways to visually represent the same price-and-time data:
- Line Chart — connects closing prices with a simple line; useful for a quick overview, but hides a lot of detail
- Bar Chart — shows open, high, low, and close (OHLC) for each time period using small vertical bars
- Candlestick Chart — shows the same OHLC data as a bar chart, but in a visually richer format that’s easier to read at a glance — this is the format almost all professional traders use, and the one we’ll focus on throughout this series
We’ll cover candlestick charts in complete depth in our very next post, since they are the standard tool for price action and technical analysis.
5. What a Chart Actually Represents
It’s easy to forget that a chart isn’t just lines and colors — it’s a visual record of real buying and selling battles happening in the market, moment by moment. Every upward movement represents more aggressive buyers than sellers at that moment; every downward movement represents the opposite.
Pro Tip: When you look at a chart, don’t just ask “is it going up or down?” Ask “who seems to be in control right now — buyers or sellers?” This mental shift is the beginning of real price action reading, which we’ll build on heavily in the next category.
6. How to Start Reading a Chart

As a complete beginner, start simply:
- Look at the overall direction — is price generally moving up, down, or sideways over the visible period?
- Notice areas where price seemed to struggle to move higher, or struggle to fall lower — these are early hints of support and resistance, covered in our next post.
- Get comfortable adjusting the timeframe (a concept we’ll explain fully next) to see the same stock’s story at different zoom levels.
Don’t worry about interpreting every detail yet — right now, your only goal is to become comfortable looking at a chart without feeling overwhelmed.
7. Why This Category Is the Foundation of Everything Ahead

Every advanced concept later in this series — market structure, liquidity, trade setups — is really just a more detailed way of reading the same chart you’re looking at right now. Take your time with this category. Rushing past chart reading to chase “advanced strategies” is one of the most common mistakes beginners make, and it usually costs them real money later.
8. Frequently Asked Questions
Which chart type should I use as a beginner?
Candlestick charts are the industry standard and the format we’ll use throughout this series, since they display the most useful information (open, high, low, close) in an easy-to-read visual form.
Do I need paid software to read charts?
No. Most brokers, including those regulated by SEBI, provide free charting tools within their trading platforms and mobile apps.
Can I predict the market just by reading a chart?
No chart guarantees future price movement. Chart reading helps you understand probability and context — where a trade has a better or worse chance of working — not certainty.
How long does it take to get good at reading charts?
This varies by person, but consistent, deliberate practice — reviewing real charts daily, even without placing trades — accelerates the learning curve significantly.
What should I learn next?
Now that you understand what a chart represents, it’s time to learn its most fundamental visual building block: the candlestick.
Read “How to Read Candlestick Charts” to learn the exact tool professional traders use every single day.
This article is for educational purposes only and does not constitute investment or trading advice. Please read our full Disclaimer before making any trading decisions.