
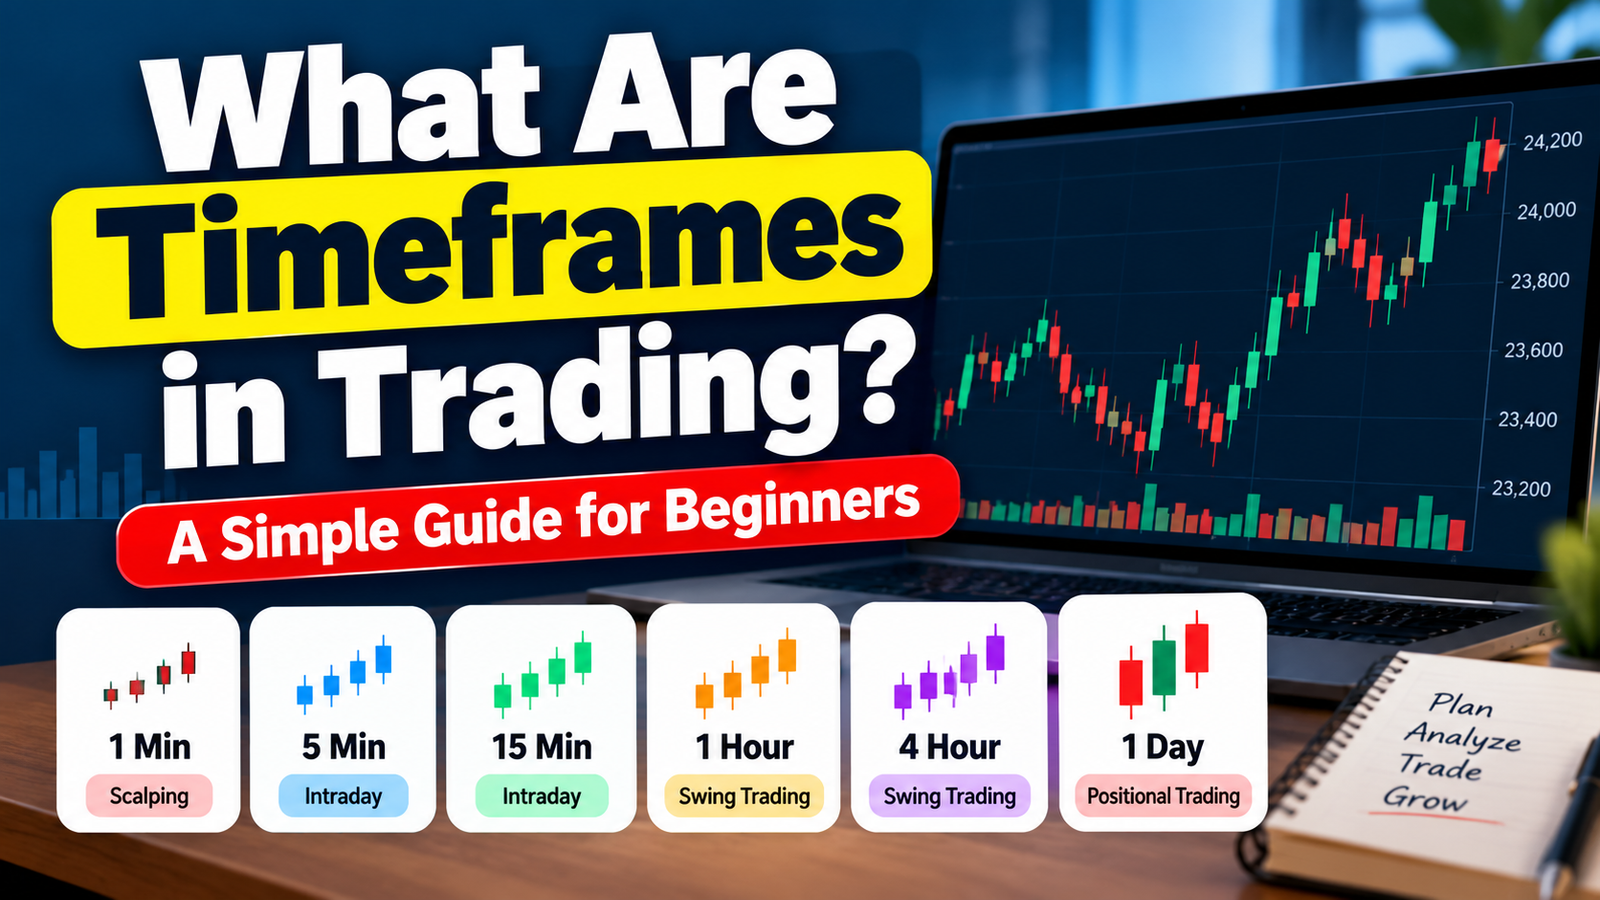
What Are Timeframes in Trading?
What are timeframes in trading, and why does the same stock look completely different depending on which one you choose? In our last lesson, we learned how to read candlestick charts — understanding OHLC, body, and wicks. But there’s a question we deliberately set aside until now: what exact time period does one candle represent? That’s what timeframes are all about.
Table of Contents
- What Are Timeframes in Trading?
- Common Timeframes Used by Traders
- The Same Stock, Different Stories
- Which Timeframe Should You Use?
- Multi-Timeframe Thinking (A Sneak Peek)
- Common Beginner Mistakes With Timeframes
- Matching Your Timeframe to Your Trading Style
- Frequently Asked Questions
1. What Are Timeframes in Trading?
A timeframe is simply the length of time that a single candlestick represents on your chart. If you select a “5-minute” timeframe, each candle summarizes five minutes of price action — its own open, high, low, and close. If you select a “daily” timeframe, each candle summarizes an entire trading day.
The underlying price data doesn’t change — only how it’s grouped and displayed changes. This is one of the most important beginner realizations: the same price movement can look completely different depending on the timeframe you’re viewing it on.
2. Common Timeframes Used by Traders

Charting platforms typically offer a wide range of timeframes. The most commonly used ones include:
- 1-minute / 5-minute — used heavily by intraday traders for fast, short-term decisions
- 15-minute / 1-hour — used by intraday and short-term swing traders for a slightly broader view
- Daily — used by swing traders and investors to see the bigger picture of recent sessions
- Weekly / Monthly — used mainly by long-term investors to study major trends over months or years
As you learned in our intraday vs swing trading comparison, your trading style strongly influences which timeframe matters most to you.
3. The Same Stock, Different Stories

Imagine a stock that’s actually trending upward over the past month. On a 1-minute chart, that same stock might look extremely choppy and random — full of small ups and downs that seem to have no clear direction. On a daily chart, those same price movements smooth out into a clear, steady uptrend.
Neither view is “wrong” — they’re simply answering different questions. The 1-minute chart answers “what’s happening right now, this instant?” The daily chart answers “what’s the broader trend over recent weeks?” Confusing these two questions is one of the most common sources of beginner frustration.
Pro Tip: If a trade isn’t working out and you find yourself zooming into smaller and smaller timeframes hoping to find a reason it should recover, stop. This is usually emotional decision-making, not analysis. Define your timeframe before entering a trade, and stick with it.
4. Which Timeframe Should You Use?

There’s no single “correct” timeframe — it depends entirely on your trading style:
- Intraday traders typically focus on 1-minute to 15-minute charts, since they need to make fast decisions within a single day
- Swing traders typically focus on daily charts, sometimes checking hourly charts for finer entry timing
- Investors typically focus on weekly or monthly charts, since they care about long-term trends, not daily noise
As a beginner, pick the timeframe that matches the trading style you’re learning, and resist the temptation to jump between many different timeframes until you’re comfortable with one.
5. Multi-Timeframe Thinking (A Sneak Peek)

Experienced traders often look at more than one timeframe before making a decision — for example, checking the daily chart to understand the overall trend, then zooming into the hourly chart to time a precise entry. This is called multi-timeframe analysis, and it’s a skill we’ll build properly later in this series, once you’re comfortable reading a single timeframe confidently first.
For now, just know that this combination exists — you don’t need to master it yet.
6. Common Beginner Mistakes With Timeframes

- Timeframe hopping — constantly switching timeframes mid-trade looking for a chart that “agrees” with what you want to see
- Using a timeframe that doesn’t match your trading style — e.g., trying to swing trade based on a 1-minute chart
- Ignoring the bigger picture — making decisions purely on a very short timeframe without checking the broader trend on a higher timeframe
- Overanalyzing noise — treating every small wiggle on a 1-minute chart as meaningful, when it may just be short-term randomness
7. Matching Your Timeframe to Your Trading Style

If you decided earlier that swing trading suits your schedule better than intraday trading, your primary focus should be the daily chart, with the hourly chart as a secondary tool for refining entries. If you’re drawn to intraday trading, the 5-minute and 15-minute charts will likely become your primary tools.
There’s no need to master every timeframe at once — build confidence with the one that matches your chosen style first.
8. Frequently Asked Questions
What is the best timeframe for beginners?
There’s no universally “best” timeframe — it depends on your trading style. However, many educators recommend beginners start with daily charts, since they move more slowly and allow more time to think clearly without pressure.
Can I use multiple timeframes for the same trade?
Yes, this is called multi-timeframe analysis, and many experienced traders do this. As a beginner, though, it’s better to master reading one timeframe confidently before combining several.
Why does a stock look different on different timeframes?
Because each timeframe groups price data differently. Short-term noise that’s very visible on a 1-minute chart often smooths out and becomes a clear trend on a daily or weekly chart.
Does timeframe choice affect risk?
Yes, indirectly. Shorter timeframes generally require faster decisions and tighter stop losses, while longer timeframes allow more room for price to move before your plan is invalidated.
What should I learn next?
Now that you understand timeframes, it’s time to learn one of the most fundamental chart concepts of all: support and resistance — the levels where price often pauses, reverses, or breaks through.
Read “What Are Support and Resistance?” to learn one of the most widely used concepts in all of trading.
This article is for educational purposes only and does not constitute investment or trading advice. Please read our full Disclaimer before making any trading decisions.